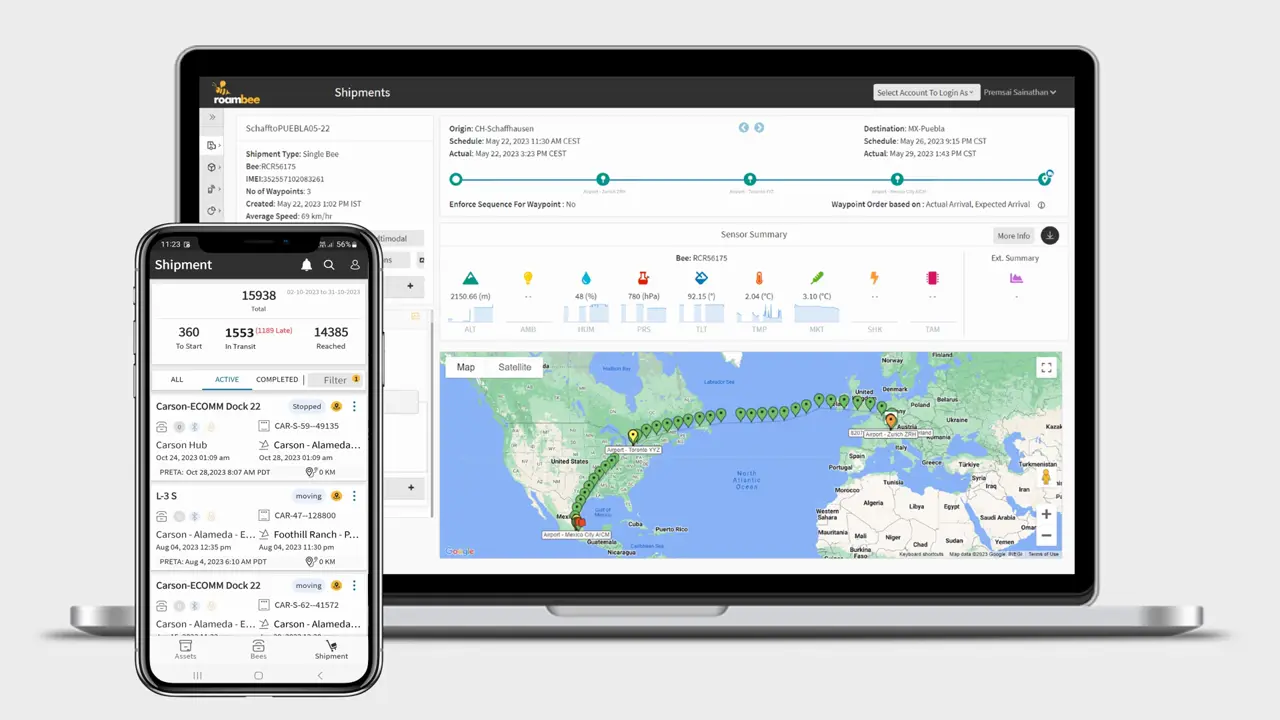
Better Visibility & Intelligence for Air Cargo
Deliver every pallet or unit load device (ULD) on time and in full (OTIF) and meet strict quality controls (QC) by automatically capturing every Cargo iQ milestone without relying on any actor in the chain of custody. Utilize sensor-driven intelligence to accurately forecast and mitigate business-critical disruptions across the multimodal network.
Comprehensive Solutions for Diverse Industries
Harness the power of our end-to-end solutions, tailored to meet the unique demands of various sectors, ensuring efficiency, reliability, and excellence in every step.

Pharma &
Life Sciences

Food &
Beverages

Electronics

Automotive

Logistics Service
Providers
Challenges with Air Cargo Visibility
Air cargo tracking commonly relies on transport visibility aggregation, a method that introduces various challenges.
CHALLENGE #1
Unverifiable, time-delayed, and unactionable information about the products and orders.
CHALLENGE #2
Visibility at an order level with no insight into network disruptions caused by individual or a group of pallet loads.
CHALLENGE #3
Complete lack of information on the condition & security of the cargo.

How Roambee Works for Air Cargo Visibility & Intelligence
Visibility
Better visibility by combining order information with real-time location and condition data from flight-safe, load-level IoT sensors and data streams from airport operations, airline traffic, freight forwarders, and carrier data aggregation platforms.
Alerts & Signals
Built on verifiable visibility, alerts & signals empower better decisions and drive automation. For example, a business signal about missed package connections is derived by sensing milestone anomalies, enabling you to minimize air cargo delays.
Intelligence
Use AI-powered network insights & foresights for better supply chain planning & execution. For example, score on-time, in-full (OTIF) performance by lane, airport, and freight forwarder and forecast this key performance indicator (KPI).
Experience the Power of Roambee
Experience the Power of Roambee
Alerts & Business Signals to Help You Make the Right Decisions
Empower your decision-making with real-time alerts and actionable business insights, ensuring timely responses to any disruptions or anomalies in your air cargo operations.
Shipment Signals

Loading & Unloading

Departure & Arrivals

Route Deviation

Customs Clearance

Electronic Proof of
Delivery (ePoD)

Temperature & Humidity
Excursion

Mean Kinetic
Temperature (MKT)

Time Out of
Refrigeration (TOR)

Tilt & Shock

ETA & Delay Signals

Pick-up & Delivery

Location & Geofencing

Authorized & Unauthorized
Package Opening

Security Screening

Loading & Unloading

Departure & Arrivals

Route Deviation

Customs Clearance

Electronic Proof of
Delivery (ePoD)

Temperature & Humidity
Excursion

Mean Kinetic
Temperature (MKT)

Time Out of
Refrigeration (TOR)

Tilt & Shock

ETA & Delay Signals

Pick-up & Delivery

Location & Geofencing

Authorized & Unauthorized
Package Opening

Security Screening
Business Signals

Delivery Time Windows

Order Fulfilment

Revenue Recognition

Delivery Time Windows

Order Fulfilment

Revenue Recognition

Cold Chain Compliance Prediction

Custody/Security Breaches

Cargo Handling (Damage)

Cold Chain Compliance Prediction

Custody/Security Breaches

Cargo Handling (Damage)

Airport Operations Anomalies: Consolidation, Wrong/Missed Connections, Customs, etc.

Flight Connections Through Unauthorized Countries

Shipment Security Risk

Airport Operations Anomalies: Consolidation, Wrong/Missed Connections, Customs, etc.

Flight Connections Through Unauthorized Countries

Shipment Security Risk
Business Outcomes with
Roambee
Business Outcomes with Roambee
Revamp your air cargo operations with Roambee. Ensure collaboration, perfect order fulfillment, and sustainability. Boost revenue and operational efficiency through real-time visibility.
- Orchestrate the flow of goods & collaborate seamlessly across all parties involved in the first mile, at airports, during transhipments, and in the last mile with the single source of truth.
- Increase revenue by delivering a flawless order fulfillment experience and transparency.
- Build a sustainable supply chain by minimizing the carbon footprint from rejected goods.
- Automate your order-to-cash process to speed up receivables and reduce working capital.
Empowering you with our Intelligence
Unlock AI-powered insights. Explore performance metrics, understand operations, and predict challenges. With Roambee, stay ahead, refine supply chains, and maintain OTIF consistency.

Insights
- OTIF performance scoring by lanes, carriers, and nodes.
- Quality compliance (QC) performance across lanes, carriers, and nodes for cold chain and handling.
- Dwell-time/Turnaround-time (TAT) insights into airports, transshipments, and shipping operations.

Foresights
- Supply risk prediction at any given node on any given day.
- OTIF and cold chain compliance SLA (service level agreements) predictions by lanes and carriers.
- Handling and security risk predictions at airports, transshipment locations, and during the first/last mile.
Enhancing OTIF Compliance for a Global Pharma Titan
- About: A top-tier US-based pharmaceutical company sought to improve on-time, in-full (OTIF) compliance and quality control (QC) in their global shipping operations.
- Roambee's Intervention: Utilizing airline and lane-wise dwell time analytics, Roambee identified the two airline carriers with the highest dwell time variance, increasing the risk of delays, temperature deviations, and security issues. A deeper dive revealed 20 out of 500+ global lanes that had six times the average stoppage times.
- Results: By addressing these 20 lanes, the company drastically reduced stoppage times from an average of 24 days to 4-5 days.
- Impact: Achieved enhanced on-time deliveries, reduced supply risks, and increased sustainability through minimized wastage.
Resources on Visibility & Intelligence

Webinar
Part 1: Telematics Aggregation vs. Sensor Driven Supply Chain Visibility

E-book
Making Smart Supply Chain Decision in the New Normal


